What's Wrong with Rating Systems?
Recently, I was thinking of "reviewing" the things I watch and play, and posting some of the reviews on this website. I quickly encountered some conundrums. What and how many metrics should I rate? How many points should the limit be? Should I restrict my ratings to integers, to one decimal place, to rationals, or to anything I like? Of course, what metrics I'll be rating depends on what the overall "thing" I'm rating overall is. My standards for a game will differ from my standards for a book. On the other hand, it would be nice to have some unifying system to compare things on their generic "goodness".
The Metrics
When rating things for fun, it's really not necessary to have well-defined criteria and metrics, but I'll do it anyway. If I rated things on vibes alone, I'd end up with lots of cases of "I'd rate X n/100 and Y m/100, where m > n, but I actually prefer X to Y." That's probably a me problem, but in any case, I like having a structure. I find it more egregious when "professionals" like the folks at IGN rate things seemingly randomly. I remember seeing a Youtube video where the person gave a category breakdown along the lines of "S, D, B, F, E" but put down the overall score as an A! This sort of thing just infuriates me.
Different things will need different metrics. I'll write down consistent tables for me to use with the obvious ones, like vidya and anime, but if I decide to rate something a little stranger, like jobs (probably will be an article eventually), I'll need to make up new metrics from scratch. None of my metrics are fixed, and maybe at some point I'll realise the system isn't very good.
Anime and Entertainment Video
This review format was designed for anime, but I suppose I can use it for other video made for entertainment purposes. More than anything else, I find myself thinking about the characters of an anime and how they interact with their world. The importance of "plot" varies greatly on what I'm watching, but I'll consider this on a case-by-case basis. All other categories are fairly uniform across anything I'd watch.
| ID | Category | Max | Explanation |
|---|---|---|---|
| 1 | Concept | 5 | How much I like the general premise or concept |
| 2 | Beginning | 5 | Rating of the first few episodes or story arc, does it set up the overall plot well? |
| 3 | Atmosphere | 15 | Worldbuilding as well as locations and the variety of them |
| 4 | Characters | 20 | How much I like and am connected to the the characters as well as how fulfilled their potentials are |
| 5 | Story | 15 | Plot, including creativity, execution, and emotional impact |
| 6 | Visuals | 10 | Animation, Art Direction, Backgrounds |
| 7 | Audio | 10 | Voice acting, music |
| 8 | Satisfaction | 10 | How much I liked the ending and whether the potential was fulfilled |
| 9 | Enjoyment | 10 | Subjective Enjoyment, the wishy washy rating |
| 0 | Total | 100 | Overall Rating |
Vidya
Games vary a lot between each other compared to other media, so 40% of the rating is placed in gameplay, the one thing which is important to all games, and another 40% is dedicated to general points which allow me to talk about things unique to the particular game. I typically don't care about visuals and audio beyond a base standard of tolerance, but if a game is exceptionally pretty that could be discussed in the 'General Positives' category, for example.
| ID | Category | Max | Explanation |
|---|---|---|---|
| 1 | Gameplay | 40 | The meat and potatoes of the game |
| 2 | Pacing and Retention | 10 | Did it ever feel like a chore to play the game? How long could it hold my attention for in one play session? |
| 3 | Visuals | 5 | Graphics, Art Direction... |
| 4 | Audio | 5 | Music, Sound Effects, Voice Acting... |
| 5 | General Positives | 20 | What I liked most about the game, and how far this goes to justify liking the game overall |
| 6 | General Negatives | 20 | Write my biggest complaints, and the overall score is based off how severe these really are |
| 0 | Total | 100 | Overall Rating |
Precision and Total
I'd like to end up with a clean out of one hundred score I can round to the nearest integer and write as a percentage. This results in there being no ambiguity to my ratings, whereas other people would get confused if I rated everything on a scale of zero to fifteen. I'll have to weight different metrics differently, but it's okay for me to give each a preliminary out of ten rating, to avoid any bias. I think it's most appropriate to rate individual metrics on a 0-10 scale, in intervals of 0.5, because this is natural to me and it doesn't really make sense to go down to 1% precision here. These ratings will be weighted and added up to make a total out of 100.
I think it's a bad idea to give each score a written meaning, because it will cloud my judgement. Take MyAnimeList for example. A "9" is taken to mean "Great", which makes sense with the overall distribution they use. However, I'd say a lot more things are "great" than I should probably give 9's to, so my judgement is clouded. Really, beyond "good, meh, bad", all of these adjectives and written explanations are totally arbitrary.
Mean and Standard Deviation
Most people tend to rate things rather highly, avoiding the lower half of the ratings. Perhaps for some people this is really just due to their kindness, and inability to be critical, but I have a more rational explanation for this phenomenon. Personally, my initial standards are quite high for me to invest my money, and more crucially, my time, into anything. If I don't think I'll have an at least six or seven out of ten experience, I won't bother. Unless you're a veteran scraping the bottom of the barrel, there's no real reason for you to watch something you don't think you'll rate very highly, for your own enjoyment. I've read a mere few books and films, watched just under twenty days of anime, and completed an admittedly disappointingly small number of games. It's therefore unsurprising that most of what I've seen has consisted of things I knew I'd have a pretty high chance of liking from the start, and hence my ratings are "abnormally" high.
I think if I really did just see everything, I would have an approximately normal review distribution. If anything, my mean score would be under 50% rather than over it, just because of how easy and common it is to produce garbage. I think the issue with having such a skewed rating distribution isn't that the ratings are "inaccurate", but that they become imprecise when everything is clustered around the top third of the scale. Making use of the rest of the scale would be beneficial to discern between different things I'd usually rate quite close to each other. I could go further than saying that "5 should be the real average, not 7", and say that rating something a 5 suggests it's "fine" or "good" rather than mediocre. I don't think I'll take this approach yet, because it would and instead I'll aim for an average score of about a 7 (remember, this only captures the stuff I think I'll like well enough in the first place).
Raising my standard deviation means I'm separating ratings out more, so I get a wider spread and more precision. My standard deviation on Anilist at the time of writing is 11, which feels too low. Making use of the 40-60% part of the distribution means I'm getting a wider spread, and as long as my distribution remains somewhere between normal and triangular, about 70%, my standard deviation will rise. I will need to get more picky with individual metrics too. For example, my ratings for art and audio are relatively likely to cluster around 7-8 because I'm not really able to criticise them, nor differentiate between the quality of different games and other things in that regard. I might have to penalise random gripes I have more severely, and treat the 0-10 range as I'd normally treat, say, 3-9.
Comparing Probability Density Functions
I want to visualise different rating distributions, to get a sense of how far off I am from an "idealised" normal distribution where the mean score is actually 50%, and to what extent this can be explained by pickiness. Beware, statistics ahead!
Define the normal distribution probability density function over \([-\infty, \infty]\) with mean m and standard deviation s. Blame Desmos for the non-Greek variables.
\[f\left(x,m,s\right)=\frac{1}{\sqrt{2\pi s^{2}}}e^{-\frac{\left(x-m\right)^{2}}{2s^{2}}}\]It follows that the truncated normal distribution over \([0, 100]\) has the probability density function \(g(x)\), which is simply the initial probability density function divided by the area under its curve between 0 and 100, so the area under any truncated distribution is always 1.
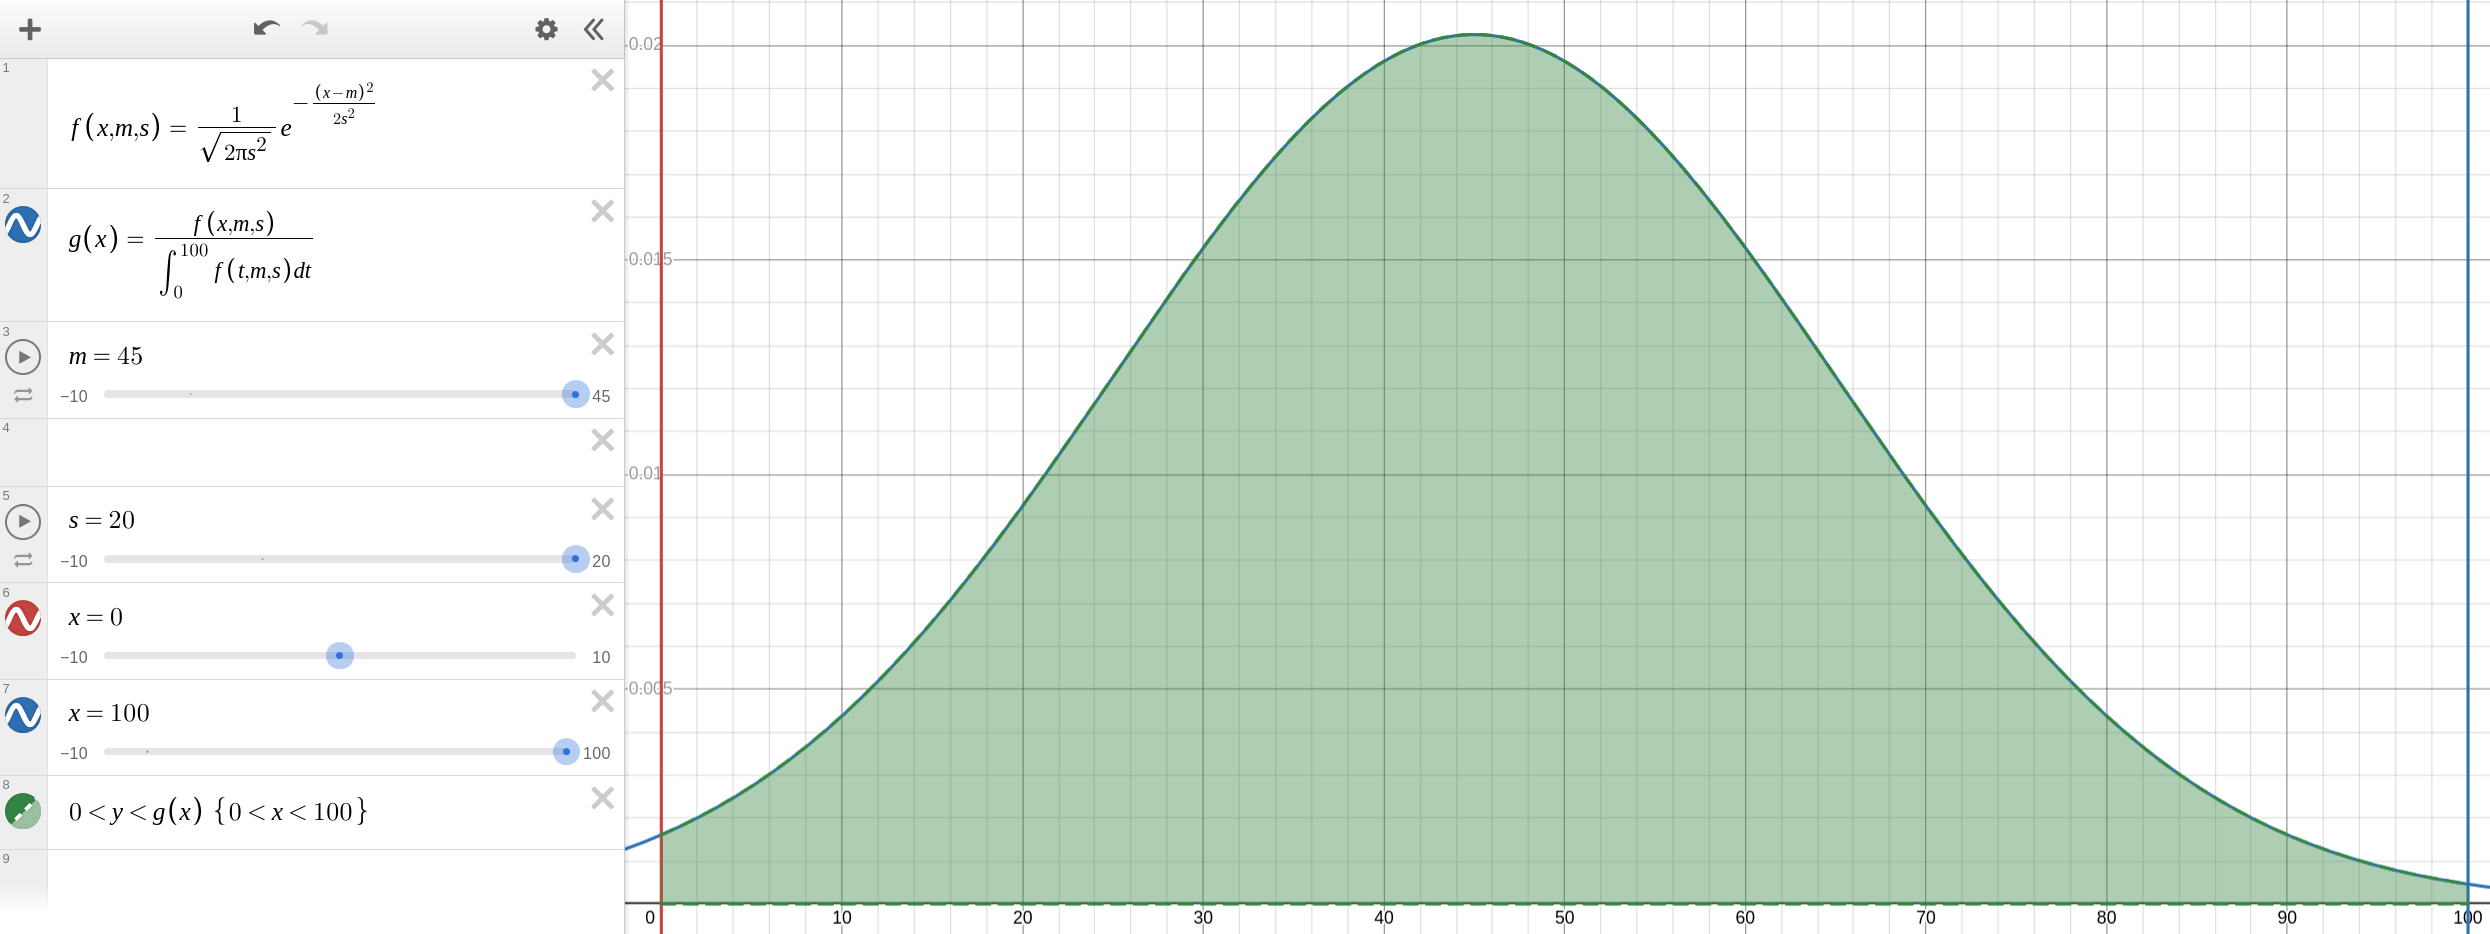
\[g\left(x\right)=\frac{f\left(x,m,s\right)}{\int_{0}^{100}f\left(t,m,s\right)dt}\]Let's assume \(m=45\), \(s=20\). I put the population mean just below 50, because I'm bound to dislike a lot of average or even above average things just because I don't like its genre or something. This, taking \(\int_{90}^{100}g\left(x\right)dx\), suggests that I'd rate rate the top 1% of the population a 9/10 or above, which feels reasonable. 3% would lie between 8 and 9, and 6% between 7 and 8. The normal distribution looks like this, and the green area is always 1, regardless of the values of \(m\) and \(s\).
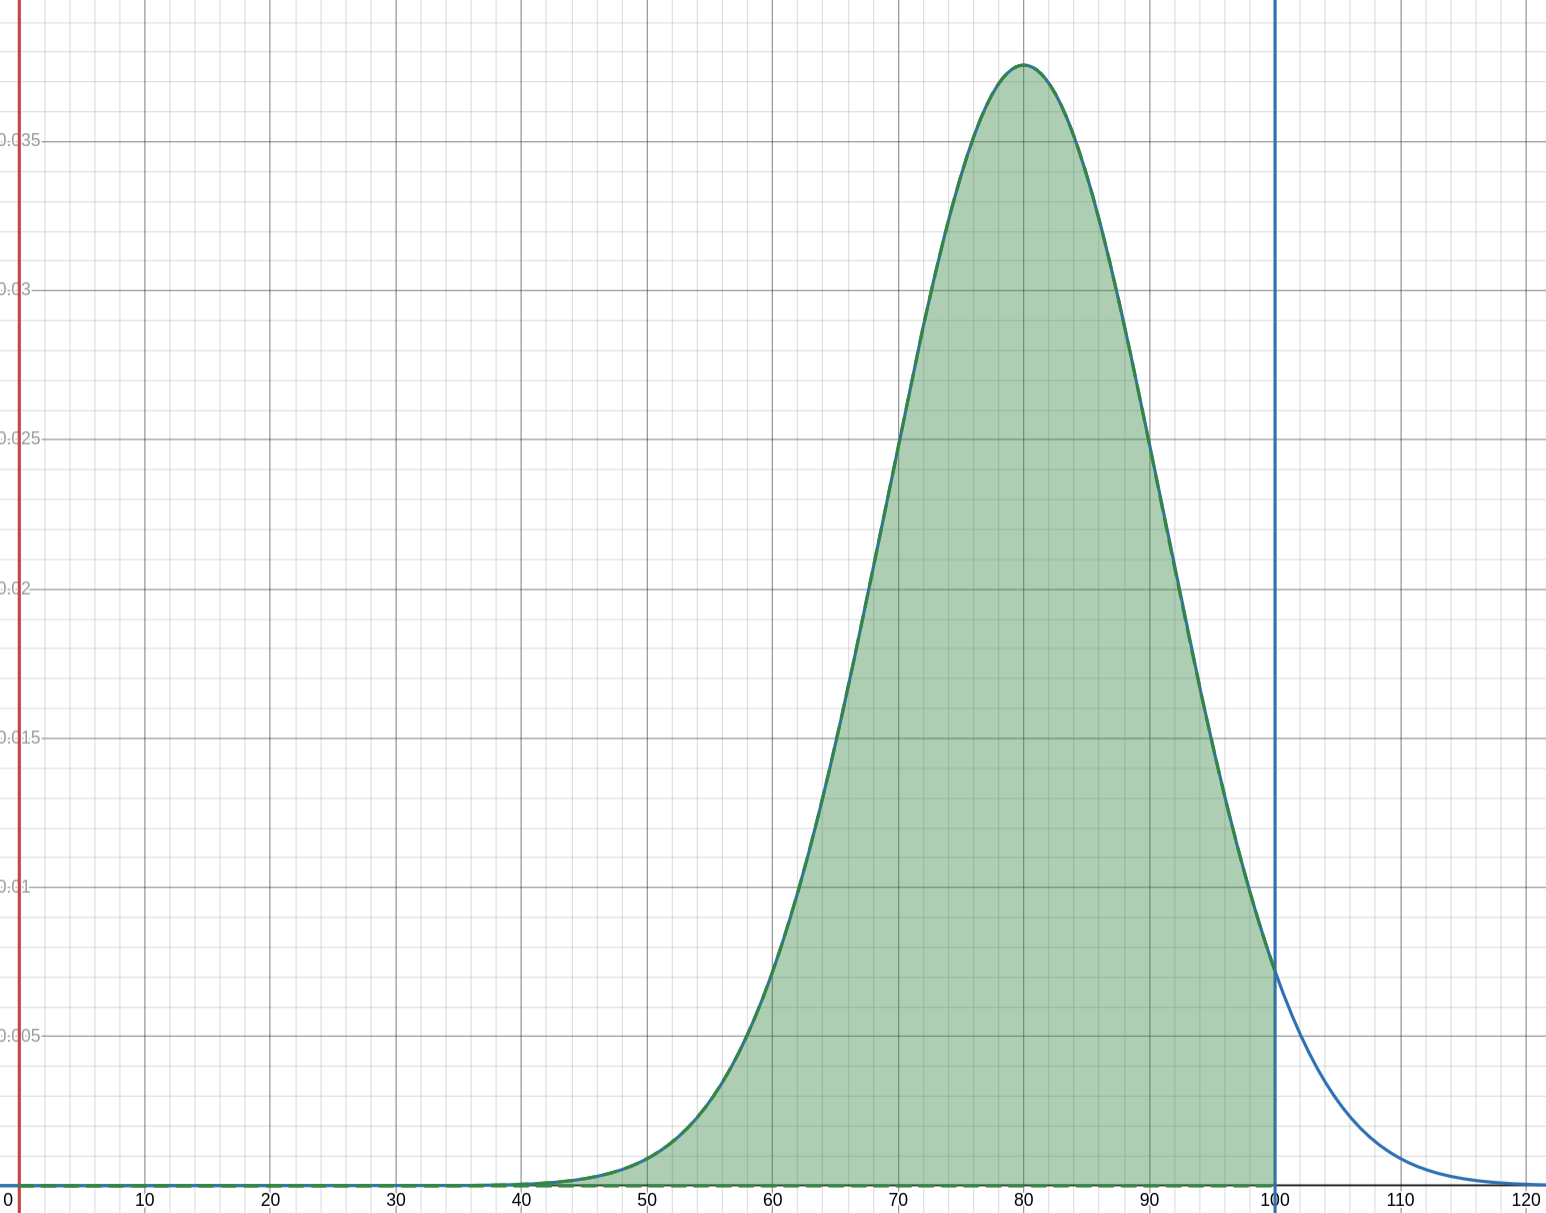
However, my ratings for what I actually watch and play (etc) are likely to be very skewed towards the better end of the distribution, due to selection bias. An extreme example of this can be taken from my current list on Anilist, with \(m=80\) and \(s=11\). A distribution this skewed makes my ratings less useful to myself, as I discussed earlier in the article, which is one reason I'm trying to introduce a proper rating system to rate things harsher. Under 20% of my predicted scores are under 70/100, which certainly isn't good! By the definition of the normal distribution (particularly the mean equalling the median), I can tell that something is just as likely to fall under 60/100 as it is to theoretically come over 100/100, suggesting there'd be as many 100/100s as there are all ratings below 60!
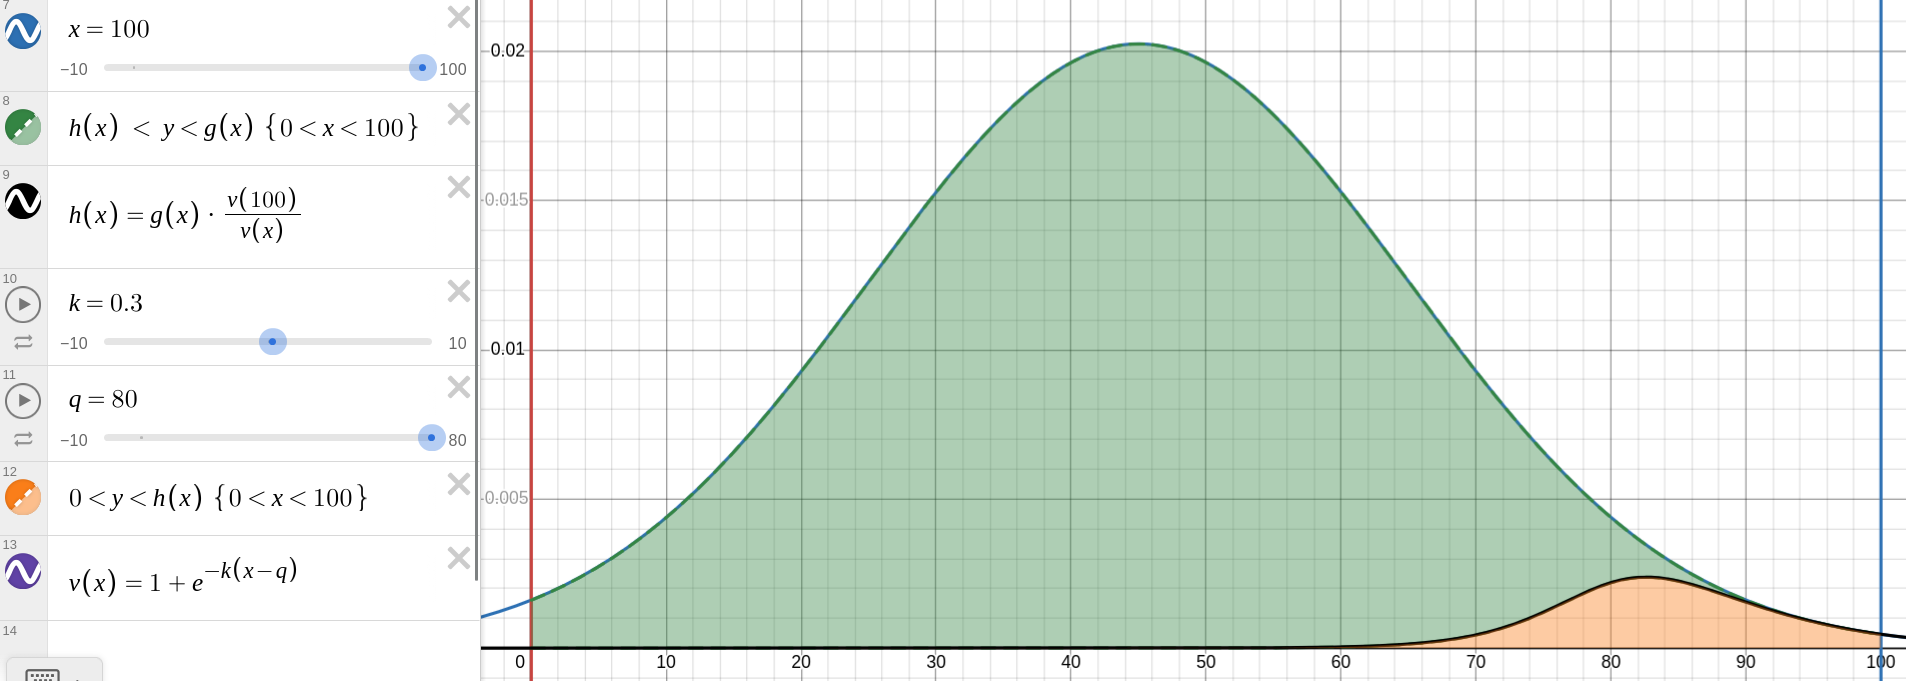
Now let's try to fit both types of curves into one, representing the region of what I actually rate within the population. The maths here gets pretty complicated, so I asked my best friend Claude, for some help. Claude recommended using a logistic function \(v(x)=1+e^{-k(x−q)}\). \(k\) represents the steepness of the transition between me choosing something, or the accuracy of my choice, and \(q\) represents the median rating I give. The normal distribution with \(m=80\) and \(s=20\) is flawed, because this distribution won't actually be normal, because the median is different from the mean. Using \(h(x) = \frac{g(x)v(100)}{v(x)}\) gives a good curve, the area under which is coloured gold. With \(k=0.3\) (as suggested by Claude) and \(q=80\), the area in gold is just 4.48% of the area in green.
In this example, \(g(100) = h(100)\), but in reality, I've obviously not seen everything I'd rate a 100/100, so the \(h(x)\) curve should be damped with a vertical compression. In my aim to become a harsher critic, I'd like to reduce my \(m\) value, so my \(v\) value can be reduced without me resorting to consooming slop I know I'll dislike, and do end up disliking. Let's visualise \(m=40, s=20, q=65, k=0.2\) to finish this off. \(g(100) = h(100)\), so this example might be over my lifetime, where I see everything I could consider a 100/100.
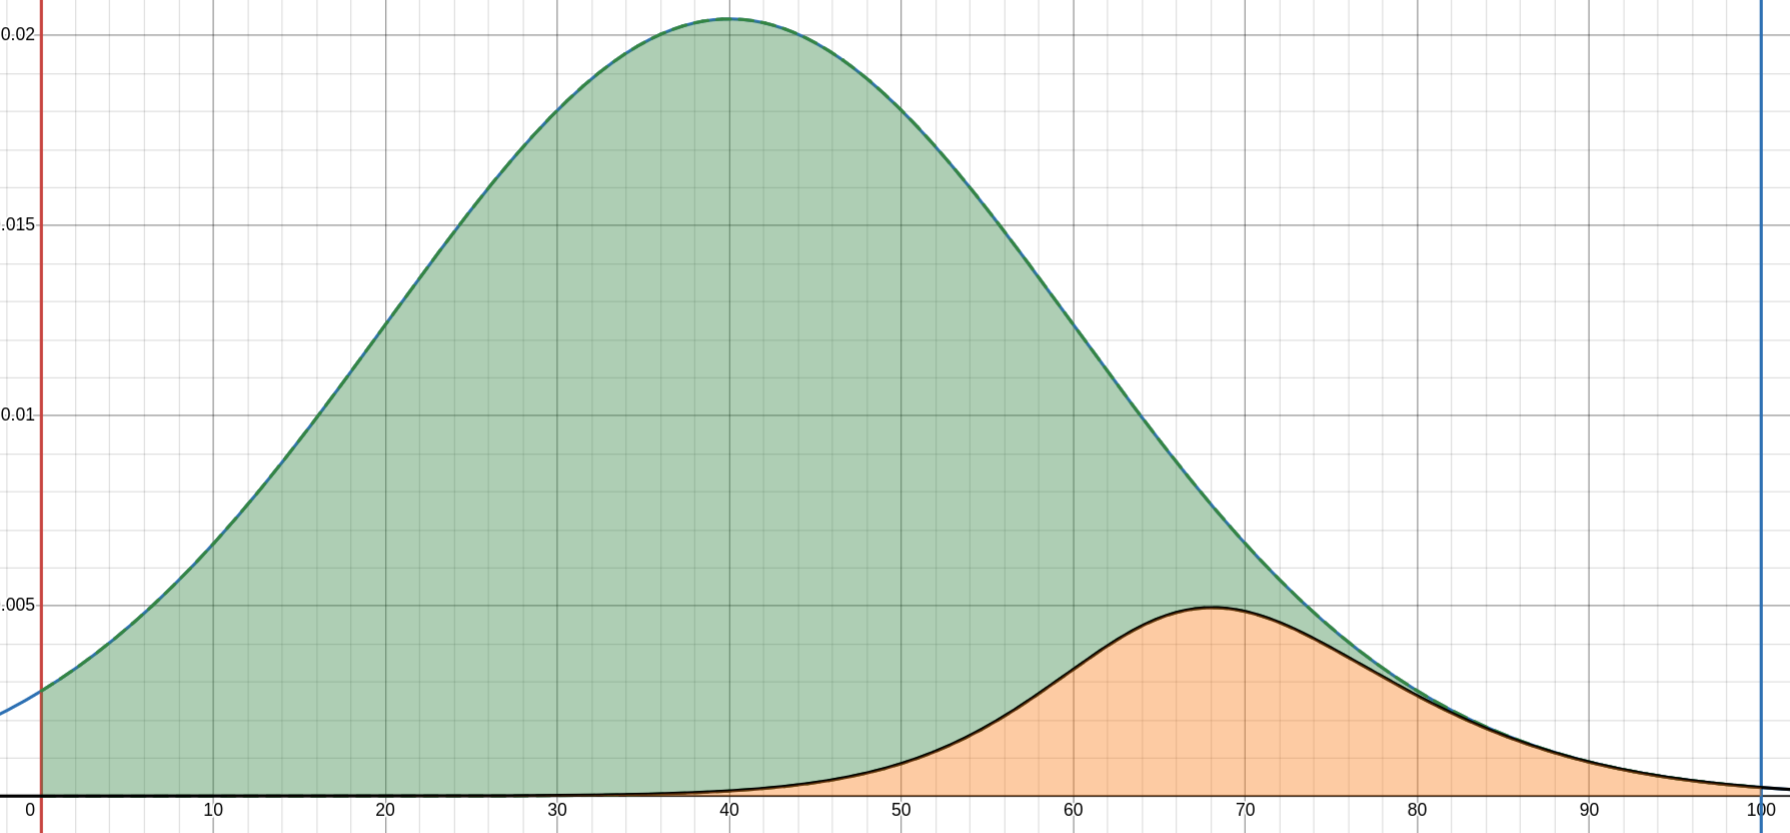
Notice the embedded curve is less steep than before, despite having to fight against the steepest gradient of the outer curve around \(x=65\), and the embedded curve peaks at \(x=68\) instead of \(x=83\). The area in gold is now 12.88% of the area in green.
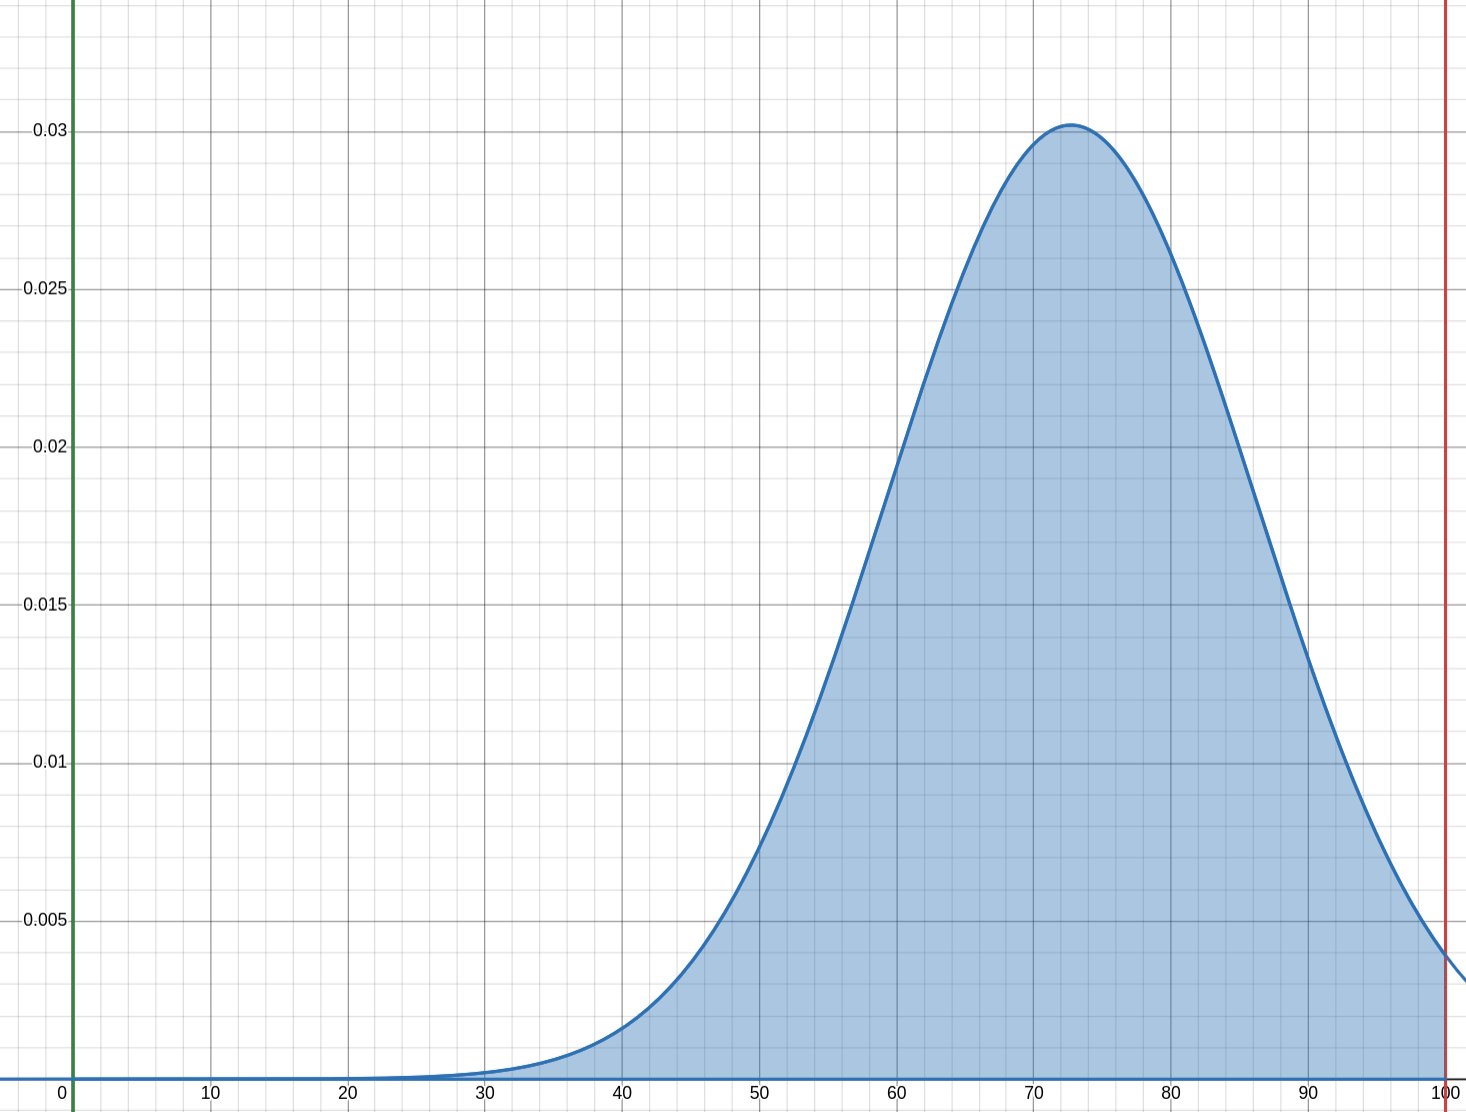
Just for fun, over a set of 236 IGN reviews from 2020-2021, adjusted to be out of 100, the mean score is 72.7, with a variance of 18.3, and a standard deviation of 13.5. The \(g(x)\) normal approximation looks like this. I feel a bit more sympathetic towards ratings institutions now, considering my personal example distribution is even more sinister than IGN's. You can't expect everyone to review all the garbage and the mediocre, of which there is always a lot. Due to the shape of the curve, estimating the proportion of ratings in an integral between \([n+\frac{1}{2}, n-\frac{1}{2}]\) will give an overestimate of lower ratings and an underestimate of higher ratings. Clearly, normal approximations aren't the best for simple 10-point scales like this, which makes me more partial to 100-point scales.